Size Exclusion Chromatography
We often hear the terms "size exclusion chromatography" and "GPC", but let's briefly review some basics to find out what sort of information they provide.
Size Exclusion Chromatography (SEC)
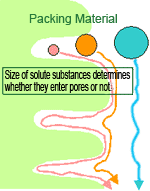
Principle of Size Exclusion Mode
Size exclusion chromatography is one of the HPLC separation modes. The column used is filled with material containing many pores. When dissolved molecules of various sizes flow into the column, smaller dissolved molecules flow more slowly through the column because they penetrate deep into the pores, whereas large dissolved molecules flow quickly through the column because they do not enter the pores. Consequently, larger molecules elute from the column sooner and smaller molecules later, which effectively sorts the molecules by size. This is the separation principle of size exclusion chromatography.
There are two basic types of size exclusion chromatography. One is gel permeation chromatography (GPC), which uses a hydrophobic column packing material and a non-aqueous mobile phase (organic solvent) to measure the molecular weight distribution of synthetic polymers. The other is gel filtration chromatography (GFC), which uses a hydrophilic packing material and an aqueous mobile phase to separate, fractionate, or measure the molecular weight distribution of molecules soluble in water, such as polysaccharides and proteins.
What information is obtained from measuring molecular weight distributions?
Methods used to measure the molecular weight of polymers include the light scattering method, osmotic pressure method, and viscosity method. These allow obtaining the average molecular weight values. However, many polymers consist of molecules with not just one weight, but rather a collection of molecules with many different weights. Even for synthetic polymers with the same average molecular weight, the distribution of their molecular weights can differ, which can result in differences in their properties, as shown in the table below.
In this regard, size exclusion chromatography enables obtaining information about how much a sample contains of respective molecular weights. Therefore, it is widely used for quality control, such as to identify differences in properties of polymers.
Synthetic Polymer Properties That Correlate to Various Average Molecular Weights and Measurement Methods
(from Shimadzu Gel Permeation Chromatography System - Application Data Book -)
| Correlating Polymer Properties | Measurement Method (absolute value) | |
| Number Average Molecular Weight (Mn) | Tensile strength, impact strength, and hardness | Osmotic pressure and vapor pressure methods |
| Weight Average Molecular Weight (Mw) | Brittleness | Light scattering and ultracentrifuge methods |
| Z-Average Molecular Weight (Mz) | Deflection and rigidity |
Types of average molecular weight include the number average molecular weight (Mn), the weight average molecular weight (Mw), z-average molecular weight (Mz), and viscosity average molecular weight (Mv).
The number average molecular weight (Mn) is calculated by dividing the total polymer weight by the total number of polymer molecules, using equation (1).

The weight average molecular weight (Mw) is calculated using equation (2), which emphasizes the contribution of polymers with larger molecular weights.

W: Total weight of polymers
Wi: Weight ofith polymer
Mi: Molecular weight of theith elution time.
Ni: Number of molecules with molecular weight Mi
Hi: Height ofith elution time
These are the relative average molecular weight values determined using size exclusion chromatography. To determine absolute values, the osmotic pressure and vapor pressure methods are used to determine Mn and light scattering and ultracentrifuge methods are used to determine Mw.
The peak molecular weight in size exclusion chromatography changes between Mn and Mw.
The polydispersity index (Mw/Mn) is used as the parameter that determines whether molecular weight distributions are narrow or broad. If the polydispersity value is close to 1.0, the distribution is narrow. Larger values mean a broader distribution.
What is the calibration curve?
The following equation generally describes the relationship between the elution volume (Ve) and molecular weight (M) of polymers.
log M = b - c Ve (where b and c are constants)
A graph of this relationship is called a calibration curve. Calibration curves are prepared by using molecular weight markers with known weights to find the elution volume and plotting the logarithm of the molecular weight on the vertical axis versus the elution volume on the horizontal axis (retention time). Molecules larger than the pore size pass straight through (are excluded). This is called the exclusion limit. Conversely, molecules below a certain size completely penetrate the pores and tend to elute almost in the same position. This is called the permeation limit. The calibration curve is valid in the range between this exclusion limit and permeation limit. Within this range, the larger the molecule, the sooner it elutes and the smaller the molecule the later it elutes.
Calibration curves with a steeply sloped portion are obtained using packing materials with large pores intended to measure larger molecules. Curves with more gradual slopes are obtained using packing materials with small pores, intended for measuring smaller molecules.
The lower the slope, the larger the difference in elution volume between small differences in molecular weight. Therefore, if two columns are available that can measure the target sample molecules; the one with the less sloped calibration curve will provide more accurate molecular weights.
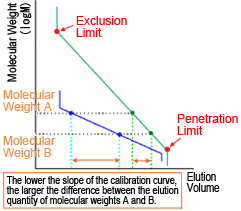
Slope of Calibration Curve and Differences in Elution Volume
Choosing a Column
Size exclusion chromatography columns are commercially available with a group (series) of different packing material pore sizes (different exclusion limits). Compare the calibration curves and select a column that is best suited to the range of molecule weights to be measured.
If the sample is distributed over a wide range of molecular weights, choose several columns from the same product series that are able to measure given sample range, then use them connected in series.
Alternatively, in some cases, a column packed with a mixture of materials with different pore sizes (mixed gel) is used. Such columns are used if the molecular weight range of target components in a sample is unknown or extremely broad.
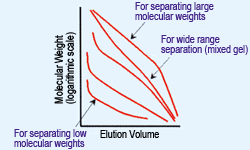
Calibration Curves for Various Columns
If samples contain molecules larger than the packing material pores, they are excluded and can cause a peak to appear near the exclusion limit. If this occurs, a column with larger pores should be selected.
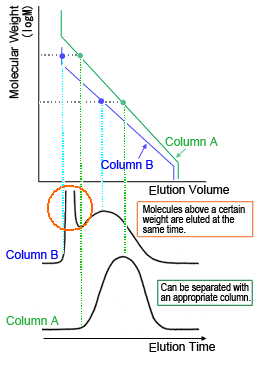
Selecting a Column (Select a column that allows using the sloped portion of the calibration curve.)
Many size exclusion chromatography columns have limitations on the eluents that can be used. Using an eluent that is not specifically permitted could irreversibly expand the packing material or otherwise cause physical deterioration. Therefore, investigate which solvents readily dissolve the sample in advance and then choose a column compatible with one of those solvents.
Key Points
As described in the beginning, size exclusion chromatography is a technique used to sort molecules by size. However, even for molecules with the same size, some can have a low molecular weight with a loosely packed structure, while others can have a high molecular weight with a high-densely packed structure. Depending on the type of solvent the sample is dissolved in, some structures can spread out, while others can move closer together. In other words, the molecular weight cannot be determined by elution position alone.
Therefore, if the substance in the molecular weight marker (a standard sample with molecular weights known in advance) differs from the substance in the measurement sample, molecular weights and molecular weight distributions cannot be calculated accurately. The ideal situation is a molecular weight marker of the same material as the measurement sample, if available. However, if not, use a molecular marker that is structurally as similar to the sample as possible or use correction factors, such as Q-factors (molecular weight per unit chain length), or other techniques to get as close to appropriate values as possible.
In addition, accurate molecular weight distributions cannot be determined if there is interaction between the sample components and the packing material (such as adsorption or ion exchange). Such interaction occurs frequently when using aqueous gel filtration chromatography. In such cases, a salt is added to the eluent to reduce the interaction.
Size exclusion chromatography is based on a relatively simple principle, but can involve complicated considerations when actually performing analyses or analyzing results. (Mi, Mm)
For more information about the GPC data example, refer to the Shimadzu Gel Permeation Chromatography System - Application Data Book - (C190-0032, p. 81).

To evaluate the properties of synthetic polymers, GPC systems are commonly used to measure their molecular mass distribution.
→GPC Systems Product Lineup
→Refractive Index Detector Baseline Stabilization for THF Eluents


